To start, a sketch of the knee joint I made:
In the journal article "Clinical results of isolated reconstruction of the medial patellofemoral ligament for recurrent dislocation and subluxation of the patella" by Yoshinori MIKASHIMA, Masashi KIMURA, Yasukazu KOBAYASHI, Motoko MIYAWAKI, and Taisuke TOMATS, methods of surgical treatment for recurring patella luxation are investigated. The primary ligament focused on is the medial patellofemoral ligament (MPFL), which is a ligament that connects to the MCL and prevents lateral movement of the patella.
The paper studies the results of 24 patients who underwent surgical reconstruction of the MPFL with the use of an autogenous tendon, namely, the semitendinosus, which is femoral in origin. After knee immobilization and subsequent rehabilitation, patients were allowed full movement after 4 - 6 months. 2 years later they were re-evaluated.
There are many methods to perform this procedure, with a good amount making use of artificial tendons. It was found that with the proper implementation, the use of autogenous ligament is the most beneficial, especially when using a method of bone tunneling to affix the tendon.
To prevent patella luxation, I found that the DonJoy Tru-Pull Lite is a quality brace. It prevents medial movement of the patella, thereby preventing luxation.
Thursday, March 29, 2012
Thursday, March 8, 2012
Biomechanics Midterm
For our midterm, Eric Hagan and I decided to take two elements of natural human gait (knee flexion and extension, and heel strike) and track them using sensors (potentiometer for the knee, and FSR for the heel strike). Using data from the sensors, we then created graphs and laser-cut them into acrylic mementos.
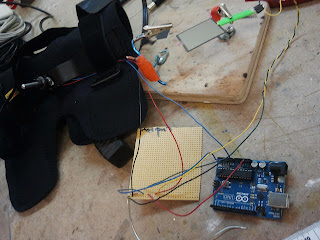
The first hurdle was getting the knee flexion and extension data. We purchased a knee brace and took apart one of the side supports, which was basically a lever that tucked into two neoprene pockets. We punched out the rivets holding them together and drilled out the holes to accept the shaft of the potentiometer.
Once completed, we secured the base of the potentiometer to one lever arm using the threads and nut already on the potentiometer. For the other arm, we stabilized the shaft on either side with shaft collars, and epoxy'd it all together.
For the FSR, my wife made a small pouch with elastic that secures to the sole of the foot. This became the base of our second data set.
We wrote Arduino code to make sure we were outputting serial data for both sensors, plus a millis column as the X axis on our graph.
We used an ethernet shield's micro SD slot to record the serial data.
We perfboarded the additional wiring and components, and it all fit into a pouch connected to the user's calf.
Now it was time to take a few walks.
After getting data for both our right legs and left legs, we plugged the data into excel and graphed it. This was then moved into Illustrator, ready for some creative license.
There was much more variation in the FSR, while the movement from the potentiometer was more subtle. For viewers to better understand the relationship between the knee movement and the heel strike, we raised the amplitude for the knee, and lowered it for the heel. This created a more aesthetically satisfactory shape.
Then it was on to cutting. For each of us, one piece is red, and another is clear, allowing us to overlay them and visually compare the difference in movement between the right leg and the left leg.
Tuesday, March 6, 2012
Final Project Idea
The name of my book is going to simply be "Dudes", featuring the muppet-like characters I like to doodle. In the book they'll do all sorts of things, while using pop-up elements throughout.
One dude alone (large fold-out of one dude face along the center fold)
Two dudes on the phone. (pop up on opposite sides of the page with string in between)
They all line up. (Several dudes standing along the center fold)
But one hides in a cup. (dude pops up through a cup using a push/pull tab)
Dudes are every place. (several dudes with different expressions on box supports)
With every kind of face. (Jacob's ladder type mechanism that cycles through expressions)
A parade of dudes.
And alternating moods. (push/pull tab alternates facial expressions)
Snakes and monsters creep (curly paper element that pops up)
in their dreams, while they sleep. ( several dudes pull down under the covers using pull tab)
Monday, February 27, 2012
Pop Up Books
Thursday, February 23, 2012
Midterm Proposal: Physical Visualization of Gait
For our midterm in Biomechanics, Eric Hagan and I would like to implement two separate data collections of the human gait: extension and flexion of the knee joint, and recording the moment of footfall within the gait.
The knee data will be taken with a potentiometer attached to armatures that go both up and down the leg and attached to a standard knee brace. As the knee joint swings back and forth, the potentiometer oscillates and records serial data.
The footfalls will be recorded by FSRs mounted to the user's shoe soles. Every heel strike will be registered and recorded for the subsequent physical representation.
The collected data from each leg will be separately graphed, with the curved potentiometer data on one side, and the spiky heel strike data from the FSR on the other side.
Once the data visualization from both legs are cut from the laser cutter or the CNC, they can be physically mated, and the spaces between the curves and spikes can allow the user to see the eccentricity of their gait.
Thursday, February 16, 2012
FitBit Data
The above graph shows the relationship between # of steps walked per day (red), and distance walked (blue). The blue graph peaks at 13.3
See another depiction at Eric Hagan's blog.
Thursday, February 9, 2012
Hacked Mickey Mouse and range of motion
I hacked a Mickey Mouse toy in order to measure sagittal flexion and extension in the hip joint. I did this by finding the leads to the motor that controls the hips, and powering it externally with a battery. Oh yeah, I had to skin him first too. By doing this I was able to isolate only the motions Mickey made when walking.
I then used an angle guide for a saw to measure flexion and extension
Both flexion and extension terminated at 18 degrees, making the full range of motion 36 degrees. I believe this is comparable to a human gait, which, if I'm reading this chart correctly, is 40 degrees (30 to -10).
Subscribe to:
Comments (Atom)


